

Stage 4. Observe the territory
What it's for. Cameras tell you which species are present; satellite images show what is happening to their habitat. Together they help understand where wildlife moves, which areas are changing and where it makes sense to act. This stage is an orientation: today there are platforms you can ask questions without any background in geographic information systems.
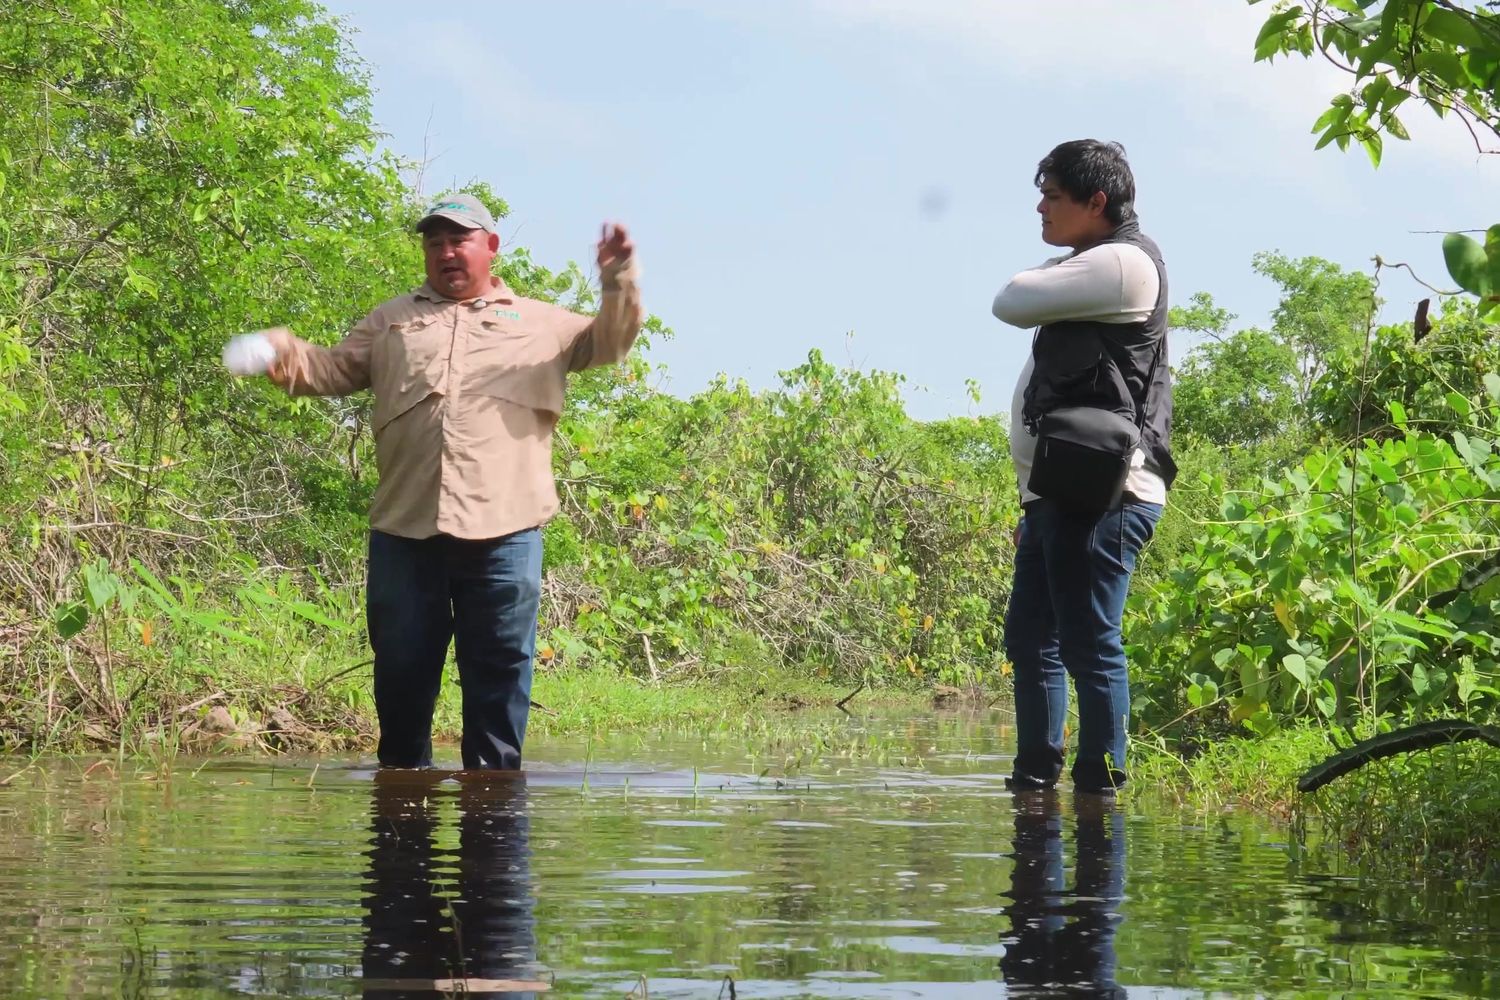 What is changing in the territory?By the end you will have: A shared reading of changes in the territory
What we did in Dzilam
The same jaguar was photographed at two sites about 40 km apart, between Dzilam and its transition toward the Ría Lagartos Biosphere Reserve. That record prompted a connectivity study between the two reserves and opened a conversation about a joint action area. The record confirms the animal was at both sites; the route it took requires more data to be known.
Where to start
- Ask the map
- Platforms such as Global Nature Watch answer plain-language questions like “how much forest has this municipality lost since 2020?”. Planet is developing a similar agent for its image archive.
- See the changes
- MapBiomas México, Dynamic World and Global Mangrove Watch show land cover and its changes year by year, with nothing to install.
- Zoom in with imagery
- Planet mosaics from the NICFI program offer monthly high-resolution imagery for the tropics, free for non-commercial use.
- Go back to the territory
- Verify in the field, with the community team, what you see on the maps. Many changes have a local explanation.
- As the team grows
- QGIS, Google Earth Engine and connectivity models require training; bring them in with academic partners or specialists.
- Protect locations
- Present maps with date, source and scale, and protect the exact locations of sensitive species.
Lesson learned
A single well-documented record can open a conversation between institutions. The value of the 40 km record lay in turning it into a question shared by two reserves.
Tools to get started
- Global Nature Watch (opens in a new tab) (WRI), with an AI assistant that answers questions about land cover and land change.
- Planet's geospatial AI agent (opens in a new tab), in private beta since May 2026.
- Planet tropical mosaics (NICFI program) (opens in a new tab), free high-resolution imagery for non-commercial use in the tropics.
- MapBiomas México (opens in a new tab), free annual land cover and land use maps.
- Dynamic World (opens in a new tab), near-real-time land cover at 10 m.
- Global Mangrove Watch (opens in a new tab), useful for mangrove coastlines like Dzilam.
- QGIS (opens in a new tab) and Google Earth Engine (opens in a new tab), for teams trained in geographic analysis.
Criteria 2.2 and 3.4 (long-term design and threat management). Land cover maps and connectivity studies support the area's long-term design and the response to its threats. See how to prepare for the Green List.
MAAP and FENAMAD, Madre de Dios, Peru
Amazon Conservation's Monitoring of the Andean Amazon Project (MAAP) has published short reports based on satellite imagery since 2015. It shares its analyses with the Native Federation of the Madre de Dios River and Tributaries (FENAMAD), which represents 38 Indigenous communities and uses them for patrols and legal action against illegal incursions. Its format, one map and one message per report, is a good model for communicating findings to authorities and communities.